Gantt Charts
Build Gantt charts in minutes and give your team the project visibility they need. See the high-level overview of any project over time.
Try Free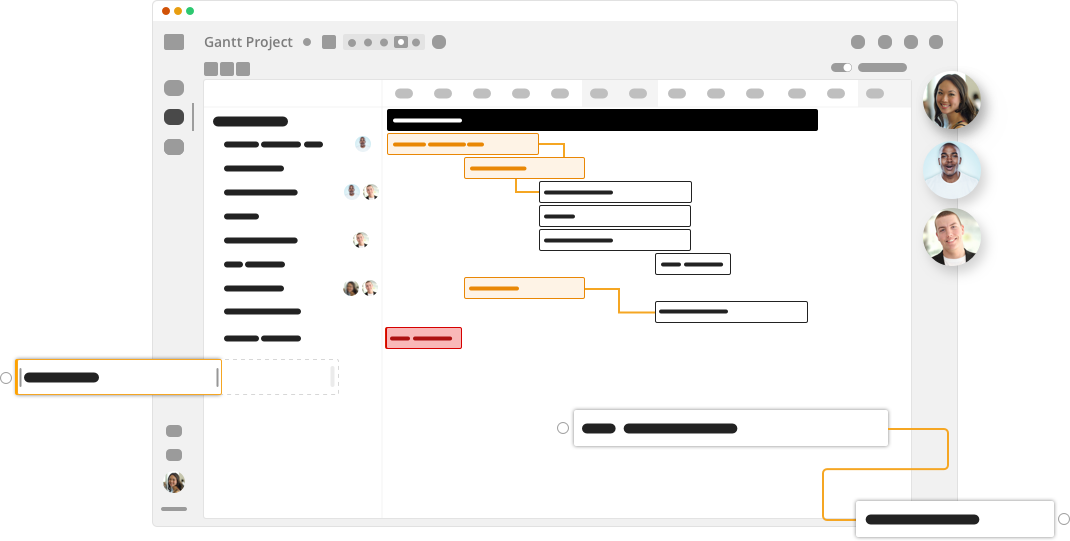
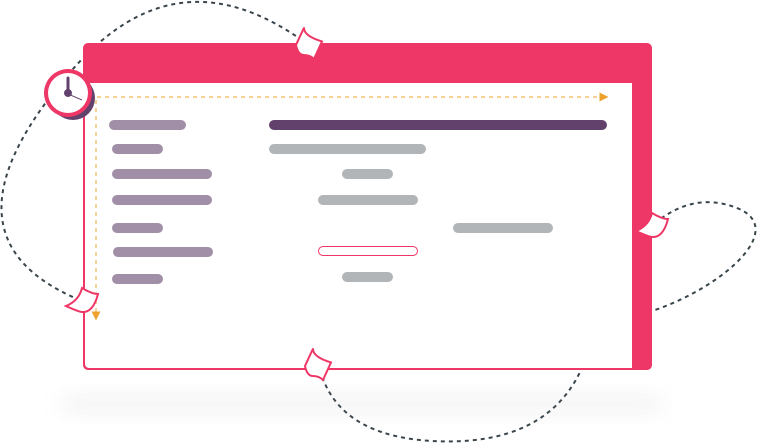
What are Gantt charts?
Gantt charts, much like kanban boards, are an excellent way to see a project unfold over time. You can use Gantt charts to:
- Efficiently plan your project
- Communicate its progress to your stakeholders
- Give your team project visibility across the entire lifecycle
- See your tasks all in one place
Build Gantt charts in minutes with Rindle
In the early days, Gantt charts were built by hand. With Rindle, you can skip the spreadsheets and the paper and scissors and build a Gantt chart in just a few minutes. It’s seriously that fast.
Beautiful, simple Gantt charts (without the complicated features)
At Rindle, we’re dedicated to only the features you absolutely need. Our Gantt charts are no different. Seamlessly and effortlessly create Gantt charts without the mess.
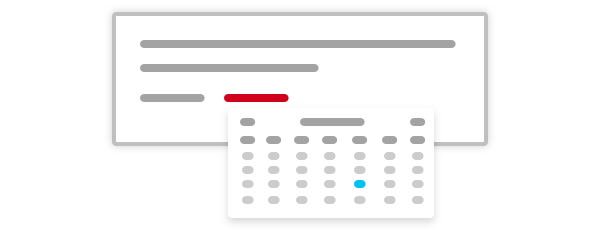
Instantly add tasks to your chart
Every board in Rindle comes with the ability to see the Gantt Chart version. Add a start date and due date to your tasks for the full effect.
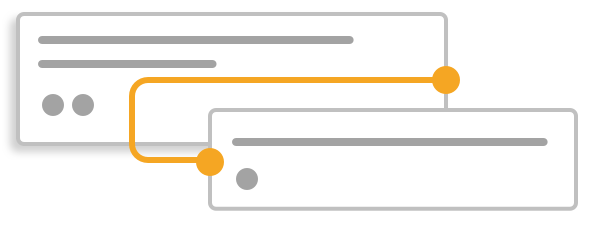
Create task dependencies
Yes — you can create dependencies for tasks! Some tasks can’t begin until another is finished. Quickly mark tasks as dependent on others directly from your Gantt Chart.
Automatically reschedule tasks
Save precious time by setting your chart to automatically push tasks down the timeline if they have any task dependencies. No more re-scheduling every task, one by one!