Management
The Top 6 Questions About Gantt Charts: Answered

Many professional managers groan when they see or hear about Gantt charts.
This is because most Gantt charts are complex, confusing, and somewhat of a challenge to build and maintain.
However, when done correctly, Gantt charts can be an awesome tool to help you manage projects effectively.
Currently, with the wealth and availability of project management software, many tools have built-in Gantt chart features and functionalities that can be created and updated in real time as projects change and evolve.
Today, Gantt charts are most commonly used for tracking project schedules and providing project visibility, particularly those projects that have a lot of moving parts. Gantt charts essentially show how tasks and activities are related and dependent upon one another, the progression of tasks, and the resources required and assigned to each activity.
Despite their popularity, Gantt charts come with a lot of questions. In this article, we will review and answer the top six questions about Gantt charts.
6 Questions About Gantt Charts
1. What is a Gantt Chart?
For those of you who are reading and are unsure of what a Gantt chart is and what it looks like, don’t fret. A Gantt chart is essentially a horizontal bar chart that is designed to help project managers monitor and control the project schedule, specifically the duration and progress of individual project tasks.
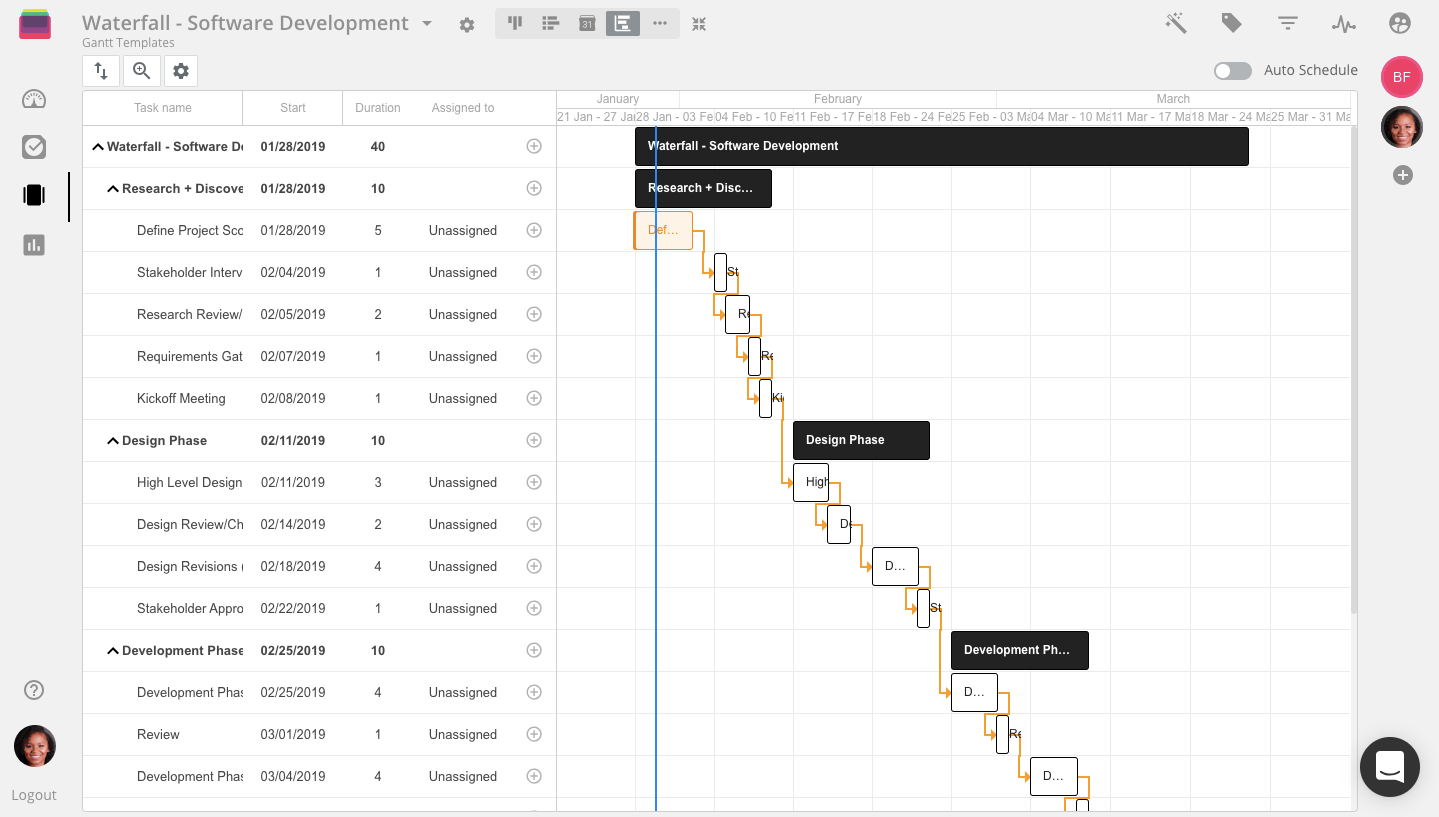
A Gantt chart is also a great visual tool that helps project managers plan projects of any size and also shows what tasks and activities are scheduled for completion on a specific day, as well as the duration of each task.
Essentially, Gantt charts show:
- The scheduled and target start and end date of each project
- Project tasks and activities
- Resources assigned to each task
- How long each task is expected to take
- When tasks start and finish
- Task dependencies
2. Who is Gantt, Anyway?
The first Gantt chart actually dates back to the mid-1890s by a Polish engineer, Karol Adamiecki, who managed a steelworks in southern Poland.
Then, approximately 15 years later, American engineer and project manager, Henry Gantt, created his own version of the chart, which became incredibly popular.
Originally Gantt charts were prepared by hand. So, every time a project changed the project manager had to redraw and reconfigure the chart. Over time, this became a laborious task. As a result, today’s project management tools have built-in Gantt chart features that update in real time.
3. When Should You Use a Gantt Chart?
As we mentioned briefly above, Gantt charts are typically best for projects with multiple moving parts and task dependencies. These types of projects can be challenging to manage, especially with many tasks that need to be completed before others can begin.
If your organization or company uses the Critical Path methodology, then you likely have a close, watchful eye on the sequence of tasks to ensure that each is completed on time in order to deliver the project as a whole on time.
Gantt charts are also a great way to report real-time project progress to project teams and stakeholders. Many project management software and tools today have an option to export a Gantt chart to share with others. These charts and reports also typically show the percentage of project completion, detailing which tasks have been completed.
4. How Do You Create a Gantt Chart?
The first step in creating or building a Gantt chart is thinking through all the steps, tasks, and activities that need to occur within a project. This can be overwhelming for many project managers, but it is an essential and necessary step in the project planning process.
Here are the steps in building a Gantt chart:
a. Identify project tasks and activities - This step can also help project managers think through how long each task will take, who will work on what, and any risks that may arise along the way. The level of detailed thinking also helps project managers ensure that their project schedules are realistic.
b. Identify task dependencies and relationships - Depending on the type of project, some tasks may need to be completed before others can begin. A Gantt chart can help you identify these relationships so you can get a deeper level of understanding of how to organize and manage your project.
When building Gantt charts, it’s important to understand the different types of tasks: liner and sequential. Linear tasks are those that are assigned to a resource and that are completed without any dependencies. Sequential tasks are those that have dependencies, meaning they rely on another task to either start or finish before work can begin.
Here is a snapshot of the different types of relationships associated with sequential tasks:
- Finish to Start (FS) – A task that cannot begin until a previous or other related task is completed.
- Start to Start (SS) – A task that cannot begin until a preceding task begins.
- Finish to Finish (FF) – A task that cannot be completed until a preceding task is completed.
c. Add all project tasks and activities into a project management tool or software - Once you have outlined all key project tasks and activities, now it is time to build them into your project management tool (we're biased and would highly recommend Rindle as your tool of choice). Watch as your Gantt chart builds right before your eyes!
d. Monitor and control project progress and schedule - Of course, your project will evolve as it moves through the milestones and lifecycle phases. A Gantt chart helps you closely monitor and control project progress, keeping a watchful eye on the schedule. It will also help you identify possible roadblocks down the line, or areas where the schedule may need to shift, depending on needs or delays.
It’s a good idea to update your Gantt chart as soon as changes occur to ensure that you and your project team are always looking at the most up-to-date schedule.
You can also quickly and easily build a Gantt chart in Rindle — an easy-to-use project management tool for teams. Through Rindle's built-in Gantt chart features, you can turn any board or project into a Gantt chart in minutes.
5. What Are the Advantages of Using Gantt Charts?
Now that you have a clearer, deeper understanding Gantt charts, here are the top advantages of using them:
- Great for project planning and scheduling
- Great for resource planning and management
- Great for monitoring and controlling project schedules
- Help keep project managers and teams honest about task completions and project schedules
- Help identify risks and task relationships and dependencies
6. What Are the Disadvantages of Using Gantt Charts?
Yes, Gantt charts are definitely useful to project managers, however, they aren’t the end-all, be-all solution for every type of project. Here are some primary disadvantages to using Gantt charts:
- Add complexity to projects
- Time-consuming to prepare and build
- Require more time and effort in managing the chart
- Tasks may only show the time for each task, not necessarily the hours involved
- Can be difficult to realign tasks from one milestone to another
- Not all tasks are visible in a high-level view
Of course, these disadvantages greatly depend on the type of project management software or tool that you use, but these are some things to keep in mind while testing different tools and Gantt charts.
Luckily, Gantt charts in Rindle eliminate many of these challenges with Gantt charts:
- Build a Gantt chart in minutes with any board in Rindle
- Limited chart management with automatic re-scheduling of tasks and task dependencies
- Easy to realign tasks with project milestones
- Toggle between seeing all tasks and subtasks or just the high-level tasks
- Choose to arrange your Gantt chart by the lists in your kanban
- Weekend settings that allow you to automatically skip weekends
Check out the video below to see Gantt charts in action with Rindle.
How A Gantt Chart Can Make Project Management Easier
All in all, Gantt charts can absolutely help manage project schedules, particularly those that involve many moving parts, tasks, activities, and resources. A Gantt chart, when built correctly, can help bring all of those items together in a single tool for easier project management.
What are some of your favorite ways to use Gantt charts?